- This topic has 1 reply, 1 voice, and was last updated 5 years, 11 months ago by
 .
.
- Topic
With new charge points being added daily, the UK’s charging point infrastructure is continually changing. The tables and charts shown below track the number of charging points across the UK and are updated live from the Zap-Map database. In addition to the number of charging devices and locations, the charts provide a breakdown by charger type, connector type and by region.
Note that this data can be used by third parties as long as the source is attributed to Zap-Map and if online, a link is added back to https://www.zap-map.com.
In addition to the market tracking below, Zap-Map offers the annual EV Charging Survey and a suite of Zap-Insights to support the roll-out of the EV sector through the provision of analytical and data support – get in touch to find out more.

As shown in the table, the total number of locations which have a public charging point installed is 11332, the number of devices at those locations is 18170 and the total number of connectors within these devices is 31580. There have been 181 new devices added to the Zap-Map database over the last 30 days which equates to 350 new connectors.

The chart shows the number of public charging connectors and locations on the Zap-Map database over the past 12 months.

The chart shows the breakdown of connectors by slow (3-5kW), fast (7-22kW), rapid (25-99kW) and ultra-rapid (100kW+) type chargers for the last nine years. As the chart reveals, the past few years has seen increased investment in fast and rapid units at the expense of slow chargers. This reflects the growing demand for higher charging rates as battery capacities increase and EVs are driven on longer journeys. From 2018 to 2019 there was also an increase in the number of slow chargers which indicates the rapid expansion of the EV market in 2019.

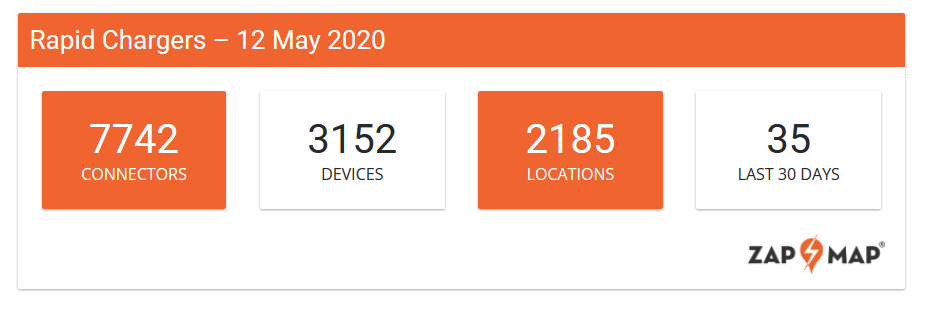
The table shows the total number of locations which have a rapid (incl. ultra-rapid) public charging point installed (2185), the number of rapid devices at those locations (3152) and the total number of rapid connectors within these devices (7742). There have been 35 new rapid devices added to the Zap-Map database over the last 30 days, which equates to 89 new rapid connectors.

Charging point statistics 2020
With new charge points being added daily, the UK’s charging point infrastructure is continually changing. The tables and charts shown below track the number of charging points across the UK and are updated live from the Zap-Map database. In addition to the number of charging devices and locations, the charts provide a breakdown by charger type, connector type and by region.Note that this data can be used by third parties as long as the source is attributed to Zap-Map and if online, a link is added back to https://www.zap-map.com.
In addition to the market tracking below, Zap-Map offers the annual EV Charging Survey and a suite of Zap-Insights to support the roll-out of the EV sector through the provision of analytical and data support – get in touch to find out more.
Zap-Stats – 12 May 2020
31580
Connectors
18170
Devices
11332
Locations
181
Last 30 daysAs shown in the table, the total number of locations which have a public charging point installed is 11332, the number of devices at those locations is 18170 and the total number of connectors within these devices is 31580. There have been 181 new devices added to the Zap-Map database over the last 30 days which equates to 350 new connectors.
Number of UK charging locations and connectors over past 12 months: Zap-Map, May 2020
PointsLocationsJun 19Jul 19Aug 19Sep 19Oct 19Nov 19Dec 19Jan 20Feb 20Mar 20Apr 20May 20010,00020,00030,00040,000Month
Points
Locations
Jun 19
23,215
8,491
Jul 19
23,970
8,805
Aug 19
24,730
9,147
Sep 19
25,676
9,441
Oct 19
26,834
9,808
Nov 19
27,775
10,132
Dec 19
28,551
10,339
Jan 20
29,526
10,625
Feb 20
30,284
10,902
Mar 20
31,059
11,190
Apr 20
31,481
11,296
May 20
31,580
11,332
The chart shows the number of public charging connectors and locations on the Zap-Map database over the past 12 months.Charging connectors by type: Zap-Map, 2011-2019
SlowFastRapidUltra-rapid201120122013201420152016201720182019010,00020,00030,000Type
Slow
Fast
Rapid
Ultra-rapid
2011
1,325
178
342012
1,611
1,193
792013
2,126
3,309
2842014
2,448
4,734
8442015
2,228
5,946
1,7102016
2,451
7,143
2,1532017
2,743
8,754
2,6632018
3,293
11,459
4,025
341
2019
5,947
16,457
6,212
876
The chart shows the breakdown of connectors by slow (3-5kW), fast (7-22kW), rapid (25-99kW) and ultra-rapid (100kW+) type chargers for the last nine years. As the chart reveals, the past few years has seen increased investment in fast and rapid units at the expense of slow chargers. This reflects the growing demand for higher charging rates as battery capacities increase and EVs are driven on longer journeys. From 2018 to 2019 there was also an increase in the number of slow chargers which indicates the rapid expansion of the EV market in 2019.Rapid Chargers – 12 May 2020
7742
Connectors
3152
Devices
2185
Locations
35
Last 30 daysThe table shows the total number of locations which have a rapid (incl. ultra-rapid) public charging point installed (2185), the number of rapid devices at those locations (3152) and the total number of rapid connectors within these devices (7742). There have been 35 new rapid devices added to the Zap-Map database over the last 30 days, which equates to 89 new rapid connectors.
Profile of rapid devices: Zap-Map, May 2020
TeslaType2CCSCHAdeMO01,0002,0003,0001
Tesla
Type2
CCS
CHAdeMO
once
454
1,781
2,432
2,664Total Rapid devices: 3152
Total Rapid connectors:7742
The chart above shows the number of charging devices across the UK which has at least one of the specified Rapid connector type. As shown, there are 2664 devices with a JEVS CHAdeMO 50-100kW connector, 1781 devices with a Type 2 Mennekes 43kW connector, 2432 with a CCS Combo 50-350kW connector and 454 Tesla superchargers (Type 2 & CCS).Note that each Rapid device, with the exception of Tesla Superchargers, has a minimum of two connectors, so the total Rapid devices (7742), is not the sum of the above number of devices by connector type.

As shown in the chart, there has been strong growth in the number of Rapid chargers in the UK from just over 30 CHAdeMO connectors in 2011 to over 7000 Rapid connectors across CHAdeMO, CCS, Tesla and Type 2 Rapid chargers by the end of 2019. From 2018 to 2019 CCS connector types saw the largest increase due to the emergence and demand for ultra-rapid charging speeds.

The pie-chart above shows the breakdown of charging point connectors in each of the UK regions. Greater London has the most charging points followed by the South-East and Scotland; the regions with the least charging points are Wales and the North-East.
Note that the statistics shown on this page can be used by third parties as long as the source is attributed to Zap-Map and if online, a link is added back to https://www.zap-map.com.
The only person who got all his work done by Friday was Robinson Crusoe.
Anything i post over three lines long please assume it is an article lol.


- You must be logged in to reply to this topic.